20080316 1-st draft A. Blecha
20140325 graph 2008-2014 added AB
back to the main document
Message to the author
Content
Summary
I report the first partial results (from October 26 to March 12) of the measurement campaign on the air-air heat pump (HP) installation in a small, well insulated (specific loss 120 watt/degree), permanently inhabited house located at the altitude of 600 m in the Lemanic region of the "Plateau Suisse". The house is 50 years old and was recently insulated according the "best effort" strategy with moderate cost. A smallest Daikin HP is heating the surface of 64 m2 and power input, external and internal temperatures are sampled every 5 minutes. The average coefficient of performance (COP) is 4.4 and the Seasonal Performance Factor (SPF) is 3.84 in excellent agreement with 3.9-4.1 predicted from the house thermal analysis and climatic data. Through the detailed analysis of the HP regulation we conclude that a new economy mode preventing the HP to switch to the high-power regime when not necessary could improve the SPF by some 4%. The measured vertical temperature profile of the heated area is almost constant with a negligible peak-to-peak variation of 0.9 degree providing an unequaled comfort (fresh floor) and contrasting with 4-5 degrees measured with electrical convectors. The air-air heat pump thus appears not only as the most economic solution (this fact was established by several studies, see for example fig. 3 at page 3) but also very comfortable and efficient solution well adapted to the "Plateau Swiss". For refitted old houses with no central heating installed, the cost of air-air solution is several times lower then the brine/water (with earth heat source) solution heavily promoted in Switzerland.Introduction
back to the content tableThis is my private report on measurement carried out at Gingins during the season 2007-2008 after the installation of the Daikin Ururu Sarara FTXR28EV air-air heat pump (HP). The purpose of this document is to demonstrate the efficiency of the installation for the heating in the geographic area of the Plateau Suisse and show the advantages and drawbacks of such system.
I installed 2 smallest Daikin HP rather then split system to have the better efficiency and some redundancy (security). The first HP, subject to the measurements, is heating 64 m2 surface while the second one is heating another 16 m2 and could be used as the back-up system. In the following we describe the measurement done on the main system though both pumps are fitted with input power counter which records the total input energy and minimum/maximum input power for the whole period.
The instantaneous input current and external unit input temperature of the air are sampled every 5 minutes. I have also some measurement of the air temperature on the (compressor) external unit output. Actually the measurements cover the period of 137 days from 26 October 2007 to 12 of March 2008 with some days without measurements so as the total number of days is 114 and 32'000 measurements. Total input energy for this period is 1500 kWh.
The internal unit is installed 70 cm above the floor and the distance between the internal and external unit is 7m.
Measured COP and SPF
back to the content tableThe average COP over the period is 4.44 and the Seasonal Performance Factor (SPF) is 3.84. These are obtained as ratio between the heat requirement computed from measured external temperature and house thermal model, and measured input energy.
All measurement available for the period 2007-2014
Measured input power
back to the content table| The histogram of the Total input energy per day shows that during the heating season most of the time the required energy is below 12 [kWh] which leads to the average input power of 0.5 [kW]. This is well under the nominal input power of 0.7 [kW] and if evenly distributed would be in the range of the best efficiency of the HP. However, the HP regime is far from "smooth". When looking at the graphic of a typical day 20080310 with total energy input 12 [kWh] we notice that the HP is either switching between high and low power (5-10h and 18-21h) or sort-off cycling between low and high level (21-24h). |
|
|
This is also visible on the histogram of all (32 000) measurements. Peaks at 300,800 and 1200 Watts indicate that
the HP has 3 stable regimes and switches between them according to the power requirement. Note that the
effect is smoothed by the fact that input power of each stable regime is temperature-dependent. The sum under the 1-st peak represents
66 % of all measurements and confirm that most of the time the HP is working close to the optimal power conditions.
There seems to be a possibility to slightly increase the overall efficiency of the HP by introducing the "economy" mode where the high-power, less efficient regime is inhibited. In most situations the user will merely want to increase the reference temperature but do not care how fast this temperature is reached. According to our measurement, the average COP could thus be improved by 2-3% and SPF by 4%. It is not much, but will only require small modification in Daikin control program. |
|
Extreme conditions
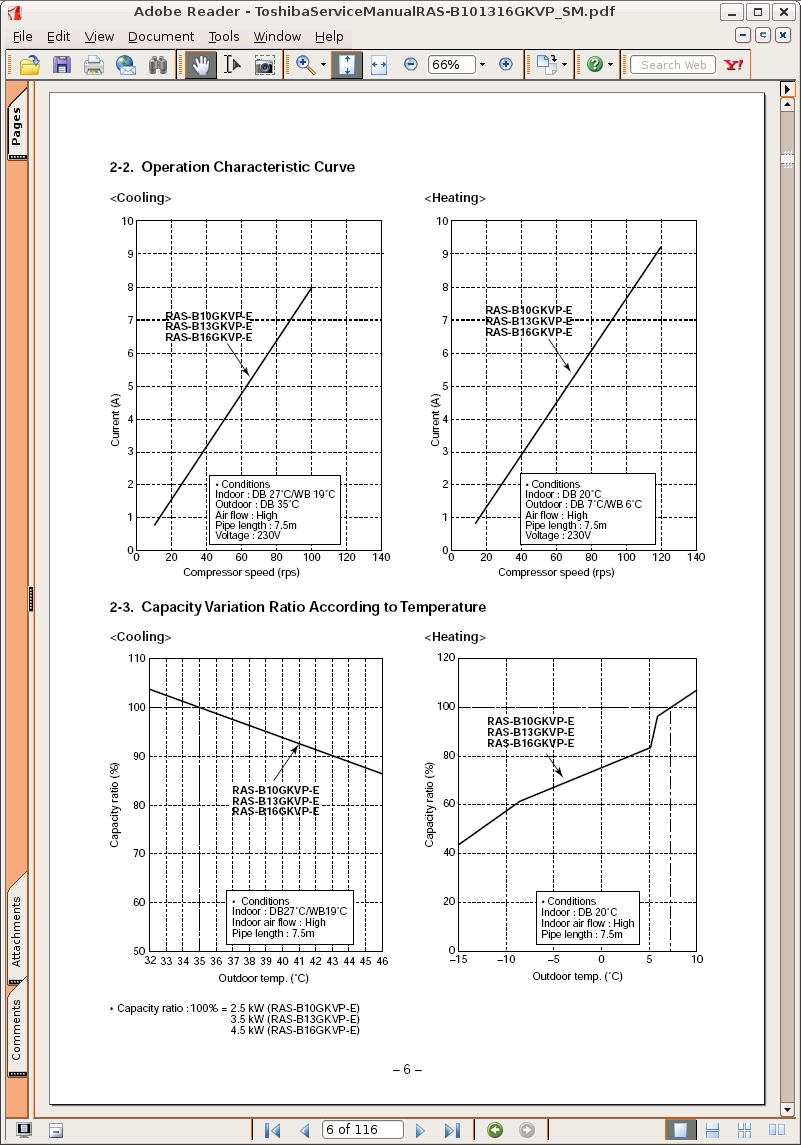
back to the content tableWhen installing air-air or air/water heat pump, the first question which arises is how it will behave at low temperature. Daikin gives -15 as operational limit but does not provide the correspondent COP at such temperature. If we base our estimate on Toshiba curves we have respectively 66%,58% and 42% of the nominal output power at -5,-10 and -15. That gives the nominal output power for Daikin 2.4,2.1 and 1.5 [kW] respectively and maximal output power somewhere below 3.3,2.9,2.1 [kW]. During the coldest period, in order to maintain the temperature of Tc=16 degrees (house was unused and was heated continuously), we measured the average input of 1 [kW] at average input temperature Ti=-8. The required output energy being (Tc-Ti)*0.12[kW]=2.75[kW] the numbers given by Toshiba seems to represent correctly the situation. Similar agreement is obtained for another cold period with Ti=-4 and Tc=21 where average input power was 0.8 [kW] and required heat output of 3kW. I can draw at least 2 conclusions:
In approximately 1% of measurements the input power exceeds the maximal input power of 1.41 [kW] given by Daikin. I recorded the maximum at 1.8 [kW] though the hourly average never exceeds 1.5 [kW]. The power counter which keeps overall min/max indicates short peaks up to 2.4 [kW].
Practical considerations
back to the content table

I should stress, that for me the drawbacks of the installation are close to negligible. I am listing them as a matter of information for those who may be more concerned.
Message to the author